Failed experiment (kind of)
Last december, me and Tristan (humble lab partner) performed an experiment where it’s goal was to measure the resistivity of a given salinity of a water bath using only theoretical equations. You would think that saltwater was the candidate choice, and it was, but on the day of experiment, we took the wrong jug with the wrong percentage of salinity, we needed roughly 3.5% salinity (accepted average salinity of saltwater), ours was 0.1%, just 1 gram of salt dissolved in nearly a liter of water.
The theoretical model
So, the objective is to measure the resistivity ($\rho$) of a saltwater bath inside a semi-circular pipe acting as a variable resistor. By varying the distance ($l$) between two terminals, we hooked up a closed circuit with a constant current ($I$). From electrodynamics, the resistance $R$ of a uniform conductor is given by
\[R = \rho\frac{l}{A}\]If we rearrange this, we get a formula to find the experimental resistivity from the slope of our data
\[\rho = m\frac{A}{l}\]where $m$ is the slope of the linear regression line ($R$ versus $l$), $A$ is the cross-sectional area of the semi-circular water bath. We had 3 hypotheses,
- The resistance $R$ between the metal terminals is directly proportional to the distance.
- The calculated resistivity will match the accepted resistivity of saltwater within experimental uncertainties.
- The best fit-line of $R$ vs. $l$ will pass through the origin.
Methods and data analysis
We used a constant 10V power source, a known series resistor, digital multimeter to measure voltages across five different lengths ($0.1, 0.2, 0.3, 0.4,$ and $0.5\text{ m}$) and taking 10 measurements at each length for a total of 50 data points, the more the better, but we had limited time.
\[\rho = B_{\text{best}} \cdot A_c \approx 5.64 \pm 0.24 \, \Omega\text{m}\]$B_{\text{best}}$ represents the slope of our linear regression ($R$ vs. $l$). These values that we calculated comes from a CSV file that we used to keep track of the data we measured, here’s a little graph that we can use to visualize.
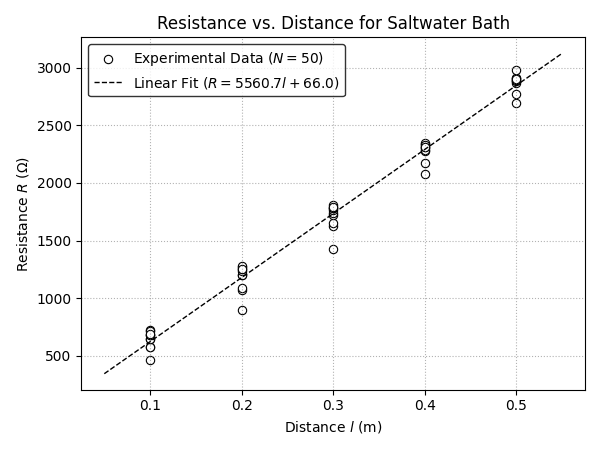
Looking at the graph, the data points line up, the regression line goes through them, but…. We used the wrong salinity!!! The resistivity is sitting at $5.64 \, \Omega\text{m}$ while seawater at normal temperature sits at around $0.2 \, \Omega\text{m}$, I mean come on, this is just sad. Interestingly, if we look at the dilution factor between standard seawater and our solution, it comes out to 32.2 (35 g/L divided by 1.08 g/L $\sim 32.2$, where 1.08 g/L was our salinity). And since ionic conduction scales linearly with concentration, taking our measured resistivity and dividing it by this factor, we get to about $0.175 \, \Omega\text{m}$ which was pretty close to our chosen accepted target $0.188 \, \Omega\text{m}$. So something tells me, if we had performed this correctly, we could’ve gotten close?
What about the Y-intercept? Well, theoretically it should be zero, but we did this using a pipe that I got from home depot, the metal terminals were made from scratch metal, and experimentally, there’s always going to be random and systematic errors. But hey, maybe that’s a sign that I should do this again but using the CORRECT salinity and more carefully.
Also, here’s the book that we used to get through uncertainties. Totally get it if you want to do experiments in labs or at home.